- The Cerberus Project
- Introduction
- 1. Chapter 0 - Pitch and Abstract
- 2. Chapter 1 - Pitch and Summer Work
- 3. Chapter 2 - Fall 2014 Work
- 4. Chapter 3 - Spring 2015 Work
- 5. Chapter 4 - Architecture Software, Dependencies and Provisioning
- 6. Chapter 5 - Current Hardware Configurations
- 7. Chapter 6 - Monitoring the Cluster
- 8. Chapter 7 - Current Limitations of the Project
- 9. Chapter 8 - Utilizing the Cerberus Program
- 10. Chapter 9 - Performance of the Project
- 11. Chapter 10 - Final Results and Special Thanks
Zabbix:
Dynamic, Scalable Node Monitoring and Realtime Statistics Monitoring
After months of testing, Zabbix was chosen to monitor the entire project, which serves to help monitor every single piece of hardware used, as well as scale to an almost infinite number of machines.

Zabbix allows for active and passive monitoring of all hosts - all across a variety of protocols. Zabbix also allows for error monitoring, alerts, notifications, command center-esque display creation and in-depth server mapping.
Monitoring the cluster is a significant undertaking, but luckily Zabbix supports almost every operating system and, with some work, routers and networking gear as well.

Above is a very in depth example of Zabbix's comprehensive mapping features. This is an example image of the entire ecosystem of thesis related services and machines, as well as their locations, network connectivity and, when activated, their statuses as well. An unlimited quantity of maps may be generated within Zabbix in order to keep all sub-systems organized as well. Each week a printout of this map is made and annotated as a scratch pad to help fuel creativity and further innovation.
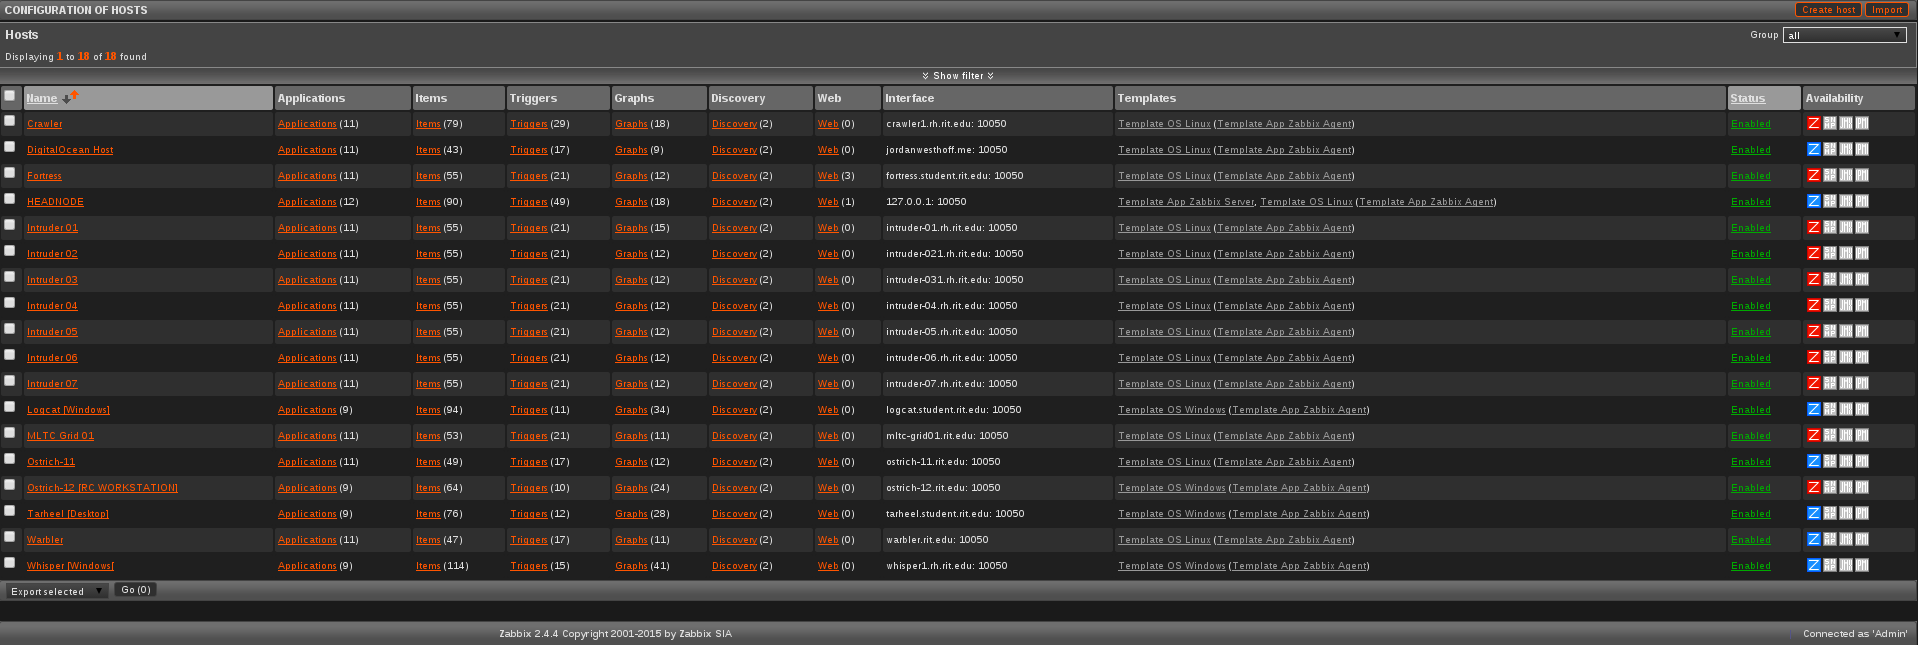
One of Zabbix's most valuable assets is that it allows for host templating, or rather, applying a template of checks and statistic gathering information to a variety of hosts. For instane, a template, named Cerberus is applied to every relevant machine entered into Zabbix upon configuration. This template ensures and checks for CPU load, memory usage, uptime, any security issues, required updates, ping, and a significant variety of other factors that all contribute to overall host reliability and performance.
Zabbix also allows for asset tracking and inventory, which is intensely useful in tracking storage and memory contained within each node. This feature is more often used adminstratively when asset tagging is required, but in this scope it also helps to ensure that each machine has the proper parts, and to make sure hard drives don't go missing or miss mount points upon initialization.
Node Monitoring
One of the core reasons to monitor the cluster is to ensure that each node is performing optimally, maintaining consistent uptime and other performance statistics. Zabbix allows the a-la-carte statistics, ie. one stat at a time, or more advanced panels of statistics can be compiled. These are referred to as Screens within the software. For instance, a single statistics, the CPU load on the Zabbix Headnode looks like this:
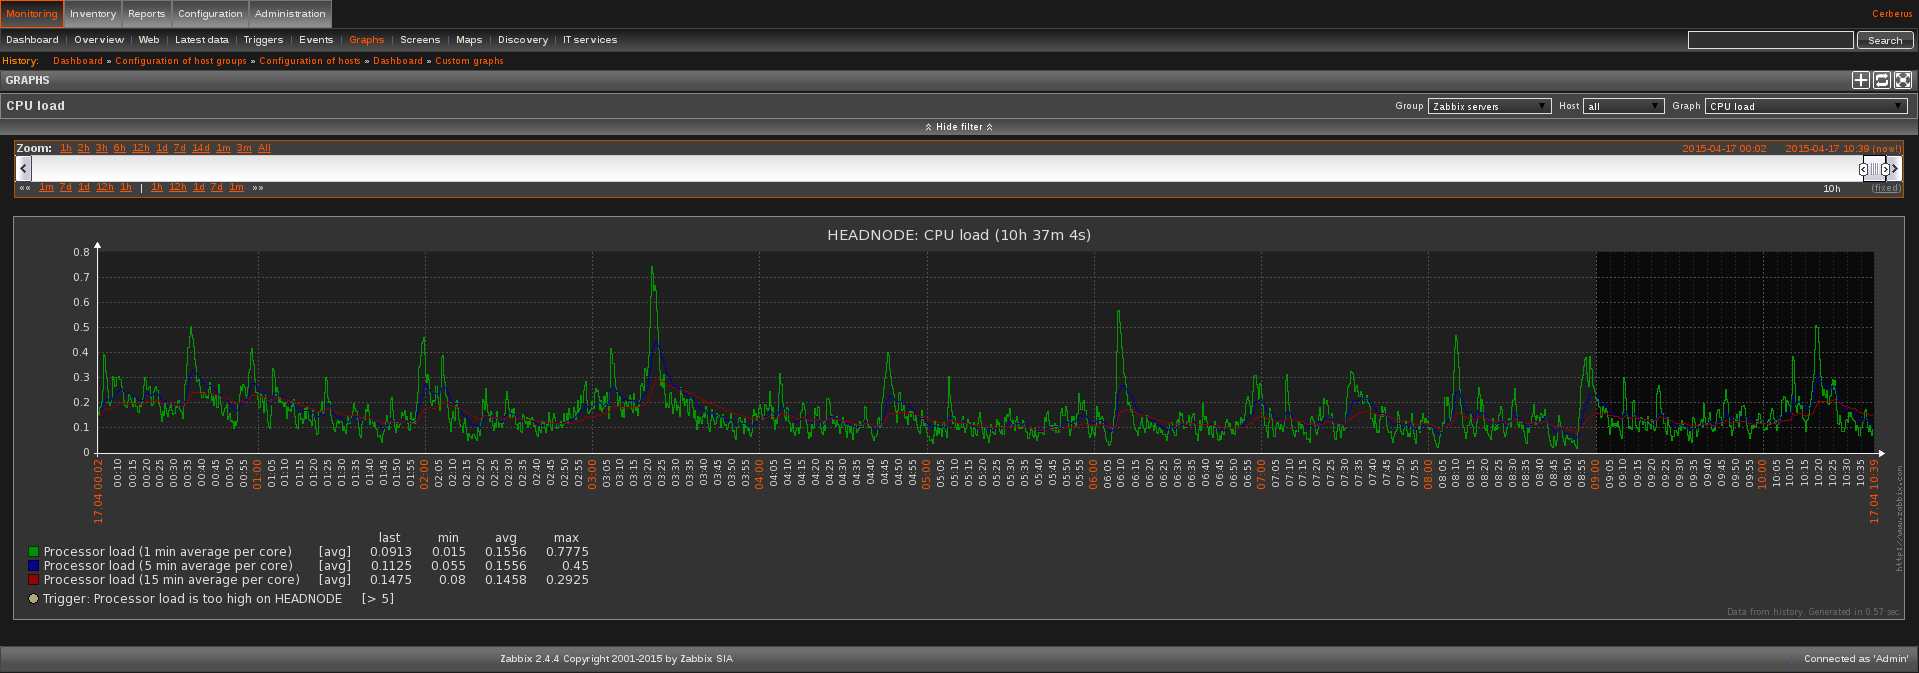
This service alone is incredibly handy - it shows the load over a variety of times, as well as letting the user filter different time blocks or select different hosts to pull stats from, but monitoring 30+ hosts at a time with this option alone would become a full time job. Thus the power of the Zabbix Screen is suddenly becoming known:
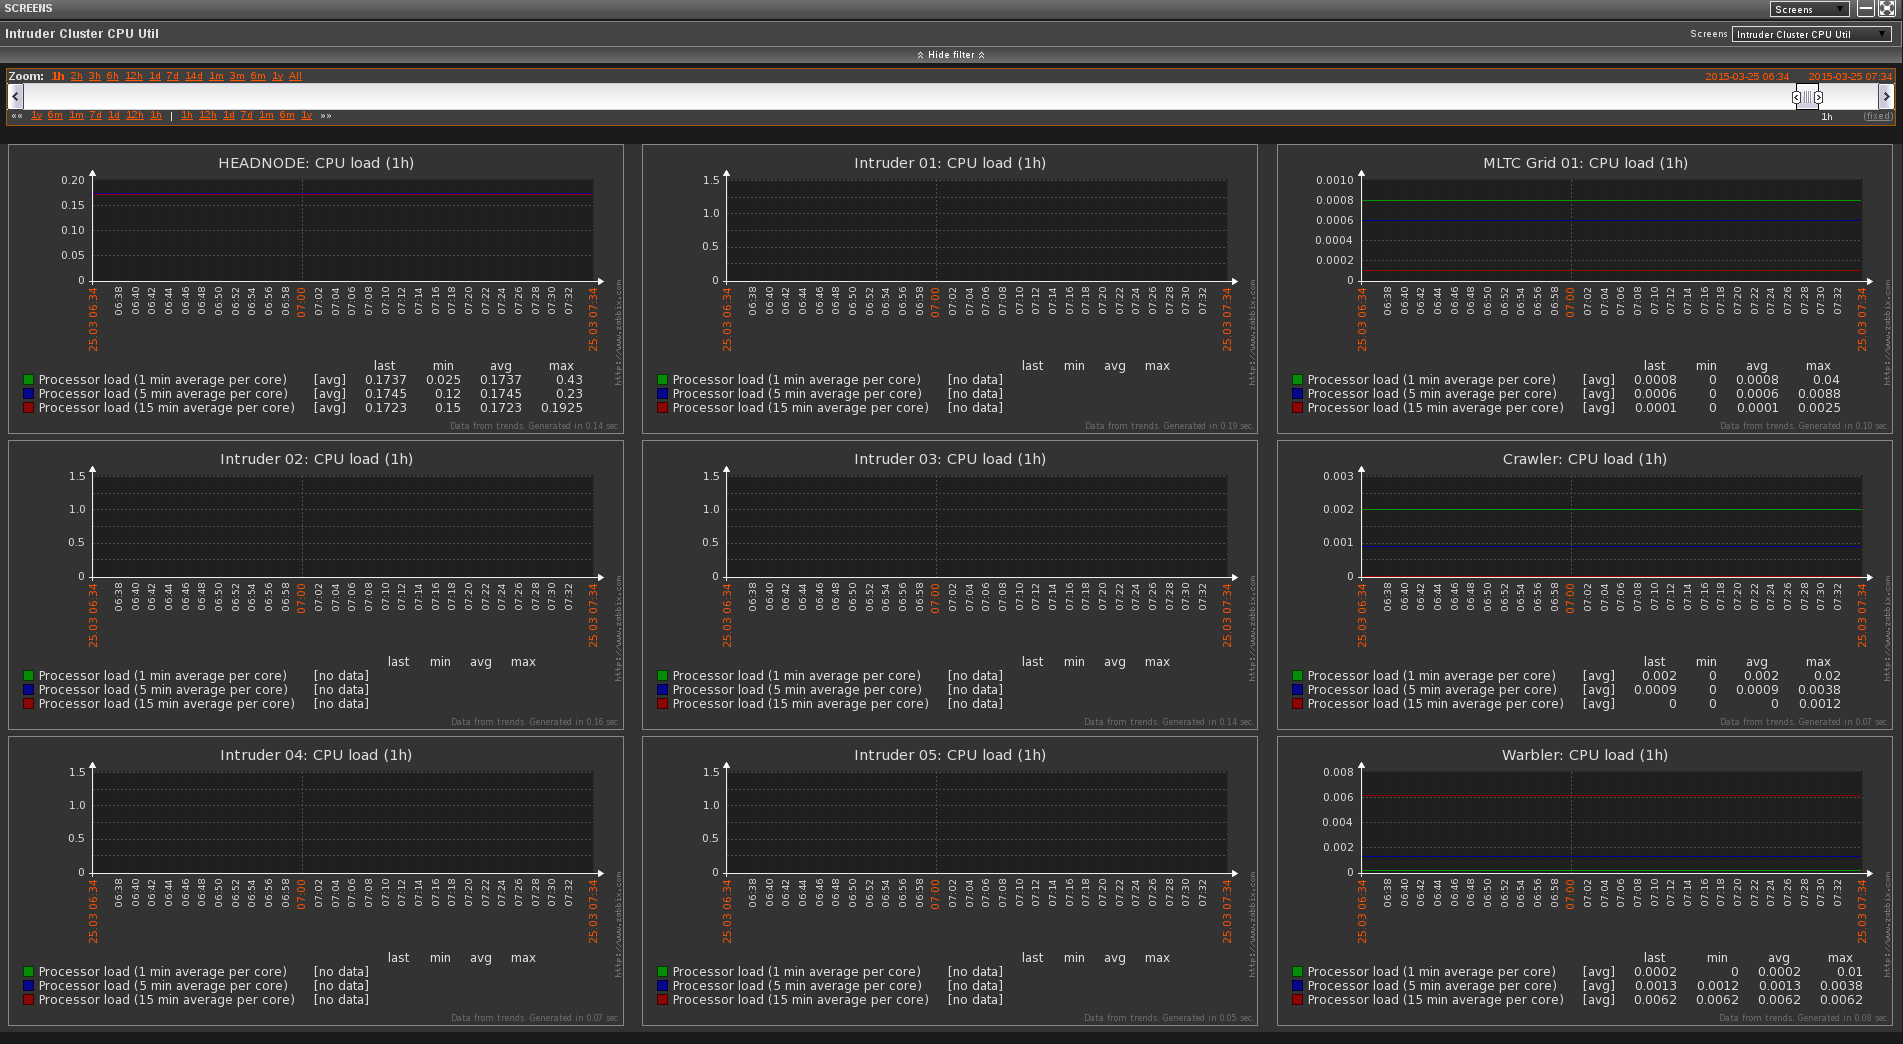
Here is a compiled screen of 9 different hosts. All of their individual CPU load counters are contained in a 3x3 grid which allows for mass monitoring to be much simpler. Screens allow for any metric to be included, for instance, CPU could be mixed with RAM graphs or partition graphs as well - they don't have to be homogenous in nature which is an incredibly powerful feature.
Screens can also be set to rotate through different sub-screens. This helps present a 'command center' feel. The primary cluster monitor is running a progressive slide show of screens that display the entire cluster's CPU stats as well as free partition space and RAM usage and core temperatures on a 70 inch television. This makes monitoring a massive collection of units very simple, especially during runtime tests.
Node Notifications
While monitoring nodes graphically is powerful and very useful, often times it is unnecessary unless specific statistics are to be gathered. For this, Zabbix notifications and the Dashboard makes for an elegant way to monitor everything in a quick at-glance fashion.
Logging into the main Zabbix panel greets the user with a general dashboard that sums up the health of all nodes and node-defined Groups.:
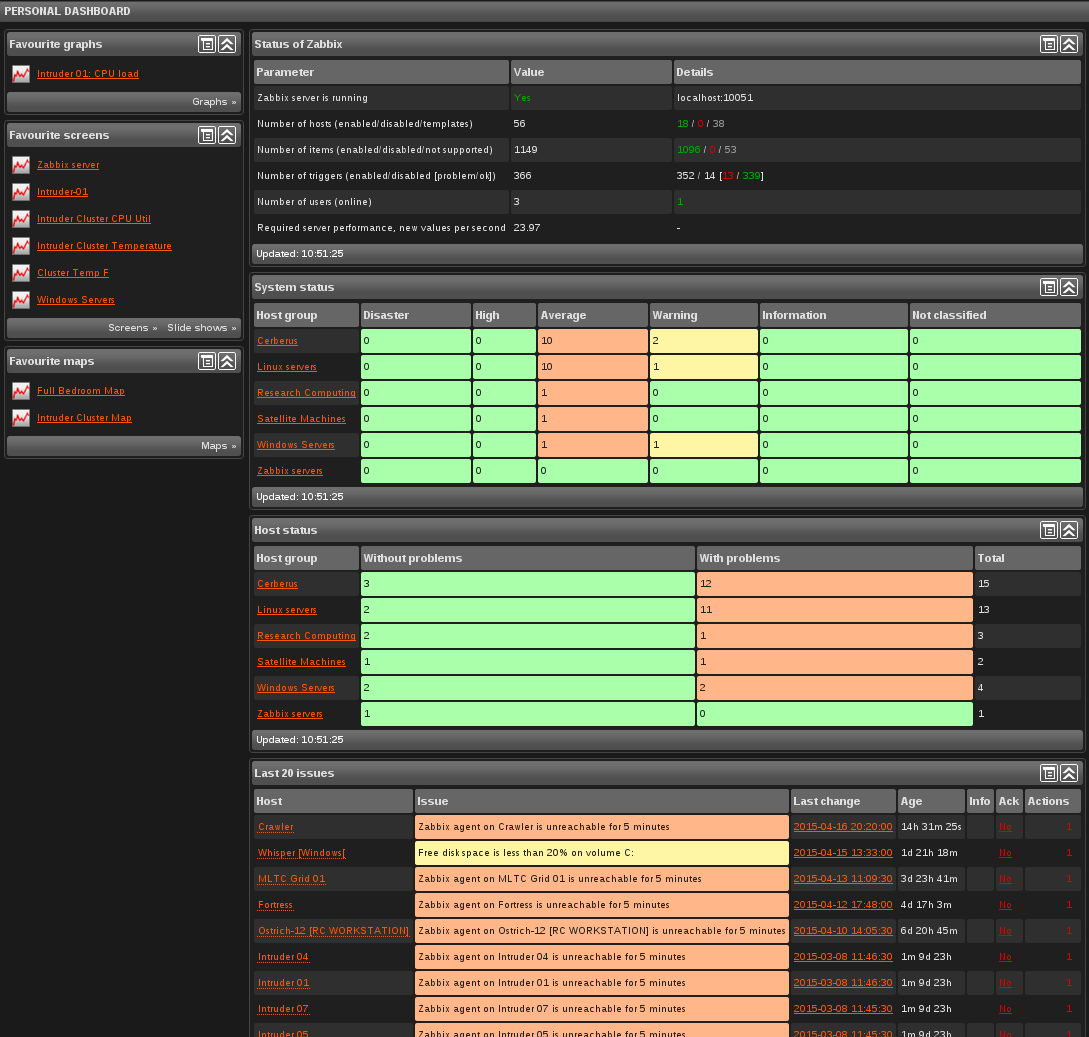
Here, a grid of errors, warnings and notifications to acknowledge are displayed. At a glance, node errors can be addressed, which saves a significant amount of time. If nodes go down and are not acknowledged via a web console, the Zabbix service is configured to email the primary admin of the issue to ensure it does not impact overall thesis runtime performance.
Web Page Performance Statistics
Zabbix also allows for another curious statistic metric to be captured. Zabbix can spin up processes on any defined node to determine the load and response times of webpages. This is especially handy for monitoring externally hosted pages and other node statistics pages (Mintr insances, or hosted HTTP info pages.
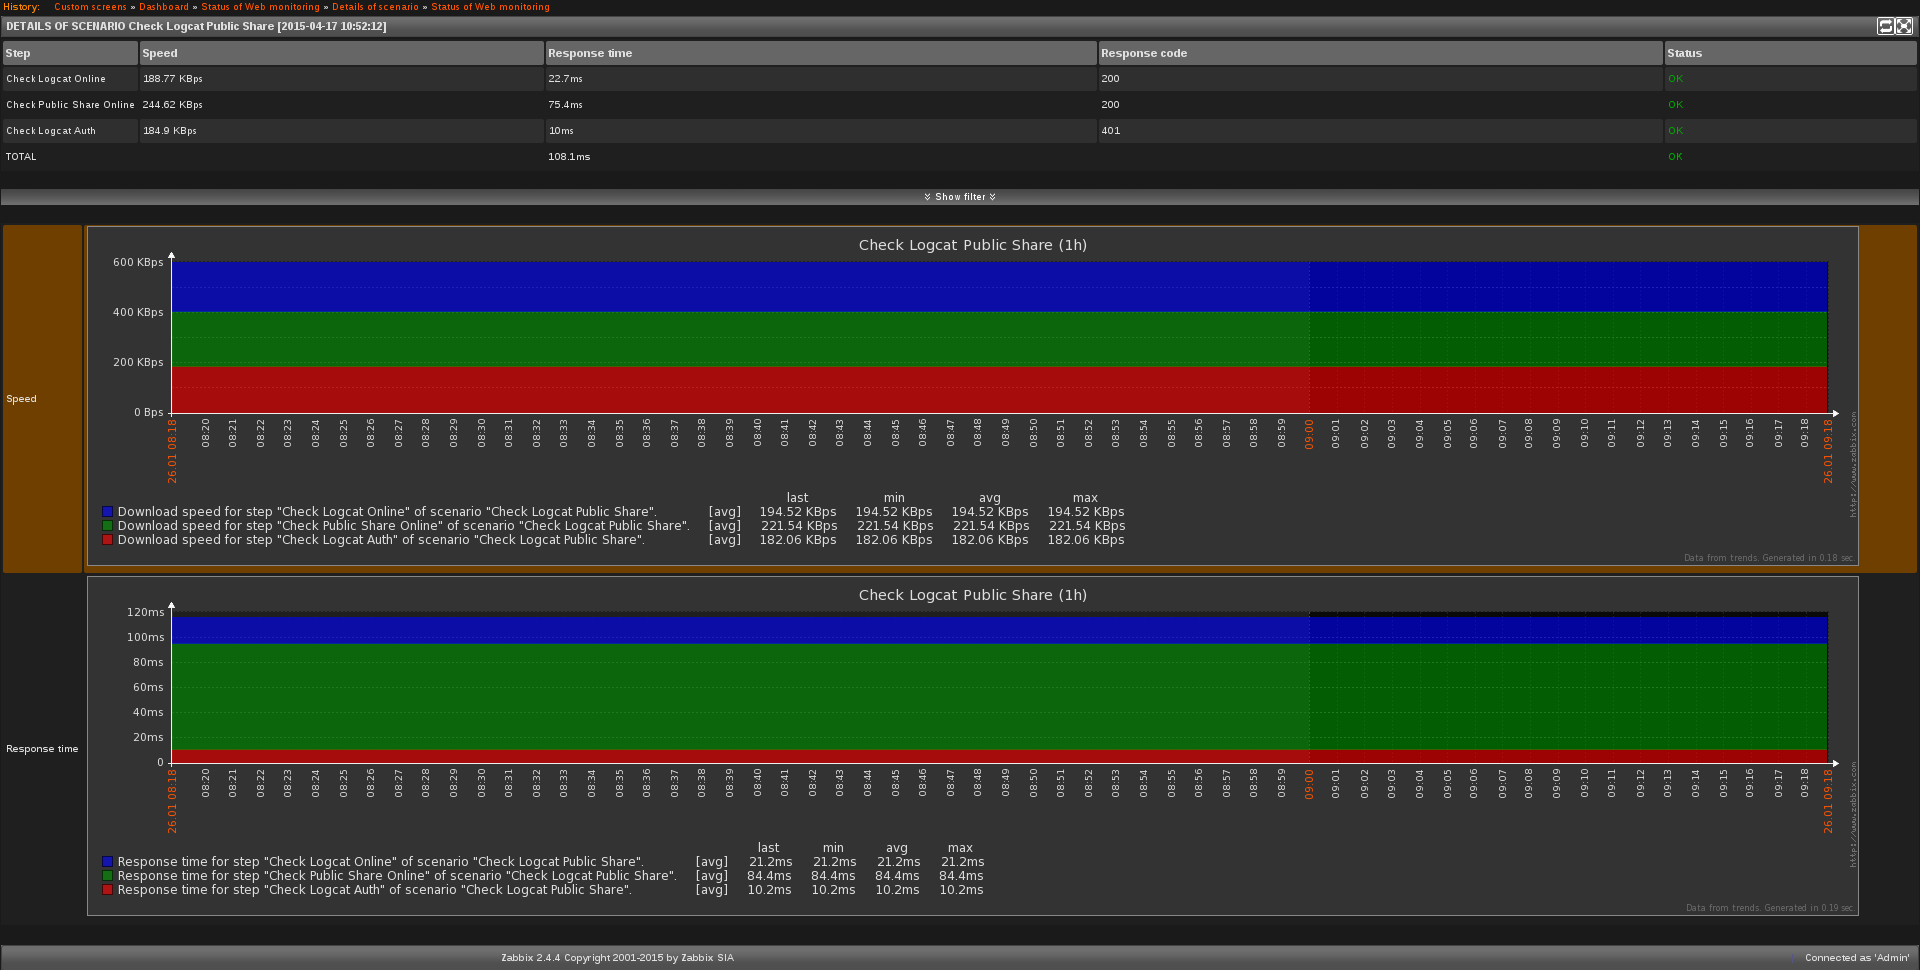
This service monitors uptime, downtime, response time and ping, as well as download and upload speeds to any specified hosts. Further, the host can also attempt to log into resources (pictured here, on Logcat, a server used for hosting thesis repositories for file assets.) and test the authentication response times and gather the returned codes to gauge reliability.
Checks have been built and set up for all forward facing HTTP assets, as well as checking to ensure internal authentication services stay active and are responsive.